Introduction to Analytics
Overview
Table of Contents:
- Summary
- Navigating the Reports
- Filtering Reports
- Exporting
- Obtaining Analytics
Summary:
Analytics is a powerful tool for understanding your business. The contained reports will show shop performance from many different perspectives. While the "Reports" tab provides data focused mainly on day-to-day finances, Analytics provides significantly more detail, with different viewing, filtering, and sorting capabilities. The "Reports" tab can show you what day of the week you earn the most money. Analytics can help you understand why.
Note: The data in Analytics is not real-time. It is updated a few times a day, with the timestamp of the latest update listed at the bottom of the Main Overview report page.
Navigating the Reports:
A brief overview of the most popular reports that Analytics contain are:
- Customer Payments
- Closed Sales
- Sales Tax
- Sublet Details
- Accounts Receivable
- Marketing
- Compensation
- Service Details
- ...and more!
Filtering Reports:
The reports will default to include all available data for the given selection - i.e. all shops, or all technicians, or all cars, etc. You can narrow the group to suit your purpose by adjusting the filters at the top of the report.
Once you have settled on a set of filters, you can save the report view for future use. To the right of the list of available reports there is a drop-down button showing the name of the view. When you first navigate to the report, the button will show Unsaved View. Clicking on it gives you the option of saving the report, and allows you to select from previously saved views.
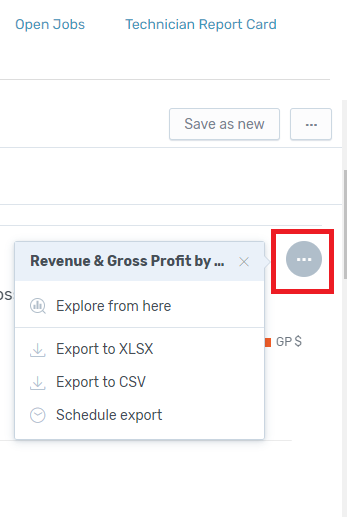
Exporting:

Obtaining Analytics:
There is an extraordinary wealth of information available in Analytics. With this tool you can apply data-driven solutions to your particular business challenges. This feature is included in the Master Plan, or can be added to any other plan. Contact your success representative for more details.